Proposal
1 Research question
Alcohol-associated liver disease (ALD) disrupts normal immune and metabolic processes in the liver. In this project, we analyze single-cell transcriptomic data to investigate how pathway activity shifts across cell types, examining evidence of immune suppression and metabolic reprogramming in immune cells.
2 Dataset(s)
ALD Dataset
- Source: https://www.ncbi.nlm.nih.gov/geo/query/acc.cgi?acc=GSE236382&utm_source (ALD Data)
- Sample size: n = 5
- Key variables: Single-cell gene expression counts per cell; disease status (ALD); cell barcode and sample of origin
- License/usage notes: Public Access (NCBI)
Control Dataset
- Source: https://www.ncbi.nlm.nih.gov/geo/query/acc.cgi?acc=GSE115469 (Control Data)
- Sample size: n = 5
- Key variables: Singe-cell gene expression counts per cell
- License/usage notes: Public Access (NCBI)
3 Planned analysis/Methods
The pipeline below shows the full planned/executed workflow from raw data to final figures:
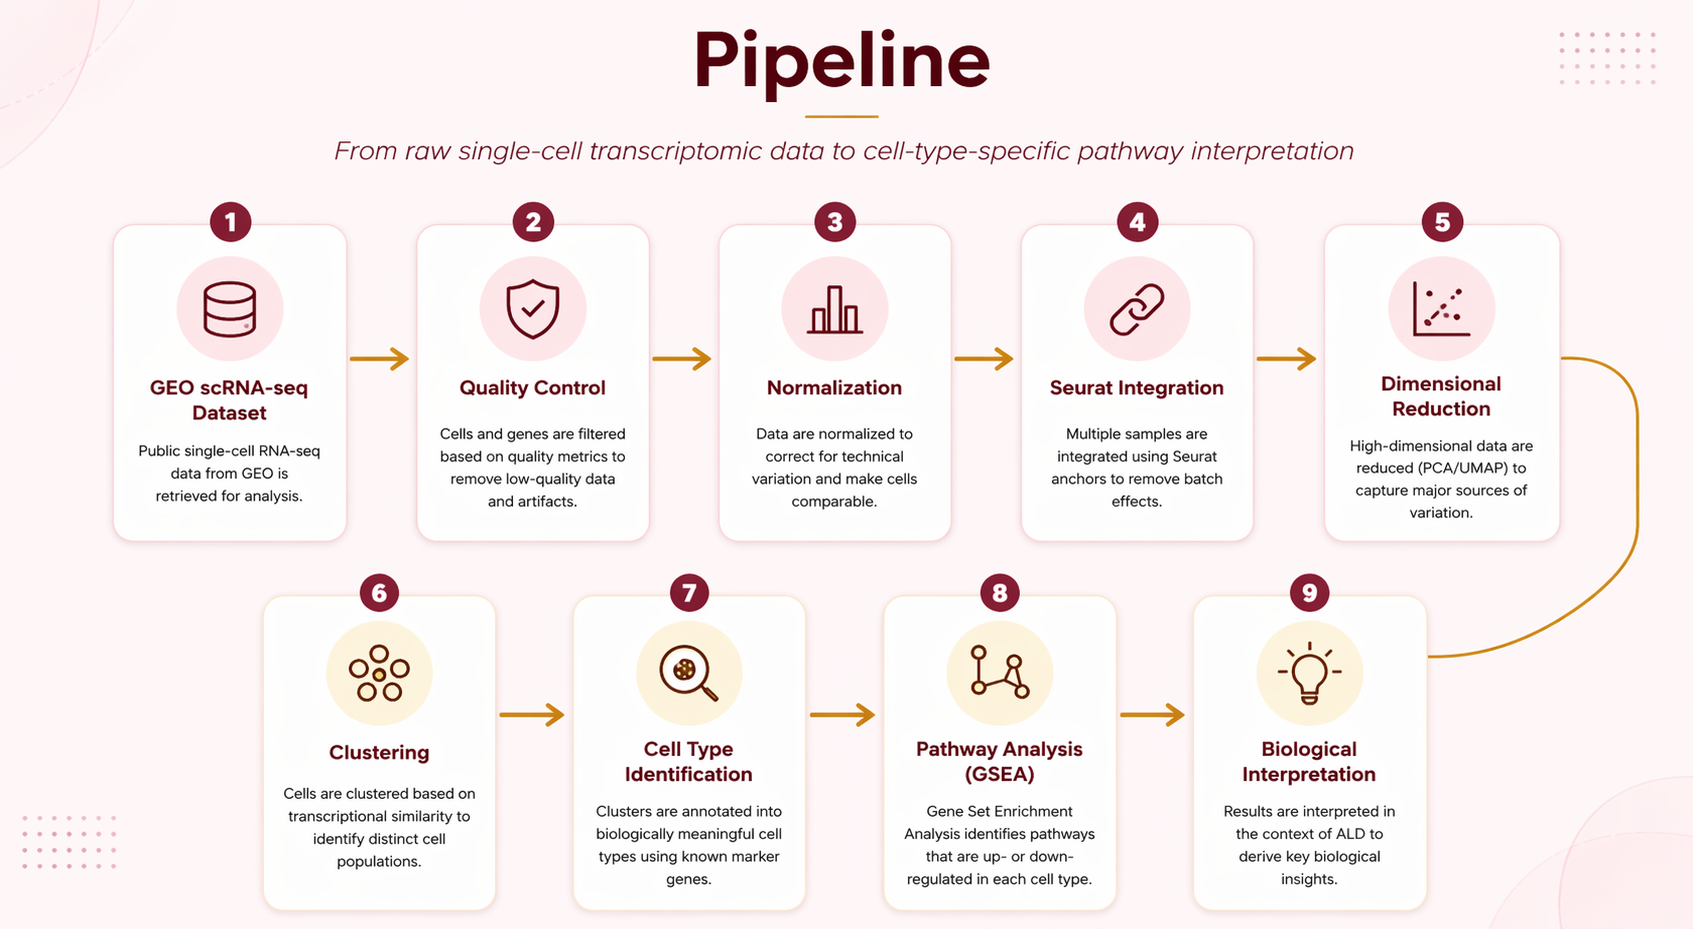
Cleaning / QC: Cells were filtered by minimum gene count (≥200), maximum gene count (≤6,000), and mitochondrial content (≤20%) to remove empty droplets, doublets, and damaged cells. Highly variable genes were identified and data were log-normalized.
Integration: Because the two datasets originated from different studies, Seurat integration was applied to remove batch effects before joint clustering (Hao et al. 2021).
Visualizations: UMAP plots were used to visualize cell clusters. Dot plots and feature plots were used to confirm cell-type annotations based on canonical marker genes.
Statistical/ML approach: Differential expression was performed within each annotated cell type using a Wilcoxon rank-sum test (adjusted p < 0.05, |log2FC| > 0.25). GSEA was performed using the fgsea package with MSigDB Hallmark gene sets, ranked by log2 fold-change (Subramanian et al. 2005; Liberzon et al. 2015).
Validation: Results were validated by cross-referencing marker gene patterns with published human liver single-cell atlases (MacParland et al. 2018; Aizarani et al. 2019). Cell-type proportion results were checked for consistency with known ALD immune phenotypes from the literature (Ju and Mandrekar 2015; Krenkel and Tacke 2017).
4 Deliverables
- Website sections
- Key figures/tables
- Any optional stretch goals